The completed campaign verifies the first sloshing mode against theory, resolves the forced-roll response from 16–26 seconds, adds a stationary baseline and sectional wall loads, and publishes complete-cycle fields plus pressure-resolved QA near the response maximum.
Overall dispositionUseful for response screening, numerical verification, and aggregate/sectional load review. Not yet a vessel-level anti-roll assessment.
A partially filled rectangular tank was evaluated with VOF CFD. Seven free-decay cases test mesh and timestep sensitivity against the analytical first-mode frequency. Thirteen forced-roll records cover 16–26 seconds, targeted 21–25 second refinement, medium/fine comparison, pressure QA, and sectional loads. One no-roll run establishes the numerical baseline.
21accepted CFD cases
7free-decay verification cases
13forced-roll records
7case-specific 1080p videos
02 · Executive findings
What the results establish
1
The first-mode frequency is reproduced consistently
Across the published mesh and timestep cases, measured frequency differs from the analytical target of 0.758054 Hz by 0.2964–0.3264%. The finest 25,600-cell case gives 0.755807 Hz.
Use: this supports the VOF model for natural-frequency prediction. The convergence sequence is monotonic but not demonstrably asymptotic, so the residual should not be represented as a formal high-order grid-convergence result.
2
Refinement resolves a local medium-mesh peak at 23 seconds for 5° roll
At 5° roll, normalized liquid-level response increases from 0.190 m/deg at 16 s through 0.22071 at 22 s to 0.22119 m/deg at 23 s, then decreases to 0.22074 at 24 s, 0.21946 at 25 s, and 0.217 at 26 s. The fine 24 s case gives 0.22145 m/deg, confirming mesh sensitivity is comparable to the small period-to-period differences.
Use: treat 22–24 seconds as the broad amplitude-peak region for this 5° sweep, not as the natural or tuning period. The exchange natural period is 14.31 s, and the amplitude peak moves with roll amplitude.
3
Aggregate roll moment remains high through 24–26 seconds
Roll-moment amplitude normalized by roll angle rises from 1.49 MN·m/deg at 16 s to approximately 1.94 MN·m/deg at 24–26 s. The level-response maximum and moment maximum therefore need not occur at exactly the same period.
Use: period selection depends on the response quantity governing the engineering decision.
4
The 24 second fine mesh changes response modestly
At 24 seconds, the medium and fine cases give liquid-level amplitudes of 1.1037 m and 1.1124 m, while aggregate roll moment changes from 9.673 MN·m to 9.815 MN·m.
Use: response magnitude is relatively stable across the published medium/fine comparison, but this single comparison does not replace a full asymptotic convergence study.
03 · Forced-roll response
Published period sweep
The principal result is present directly in the page, so it remains visible without JavaScript or external data loading.
Normalized liquid-level response (harmonic amplitude per roll degree). The sampled medium-mesh maximum is at 23 s within a broad 22–24 s plateau; aggregate roll moment keeps rising through 24–26 s (see table below).
Final-three-cycle harmonic response normalized by forcing roll amplitude
Period
Level response
Roll-moment response
Engineering reading
16 s
0.190 m/deg
1.495 MN·m/deg
Lower end of published response band
18 s
0.205 m/deg
1.687 MN·m/deg
Response increasing
20 s
0.216 m/deg
1.821 MN·m/deg
Approaching broad maximum
21 s
0.21882 m/deg
1.86463 MN·m/deg
Targeted refinement
22 s
0.22071 m/deg
1.89958 MN·m/deg
Broad plateau
23 s
0.22119 m/deg
1.92120 MN·m/deg
Sampled medium-mesh level maximum
24 s
0.22074 m/deg
1.93463 MN·m/deg
Fine, pressure, and sectional comparisons available
25 s
0.21946 m/deg
1.94061 MN·m/deg
Level response descending
26 s
0.217 m/deg
1.937 MN·m/deg
Level response reduces; moment remains high
Values are derived from the immutable release’s final-three-cycle harmonic metrics. Open the interactive study to select curves and export plots.
04 · Visual evidence
Representative completed cases
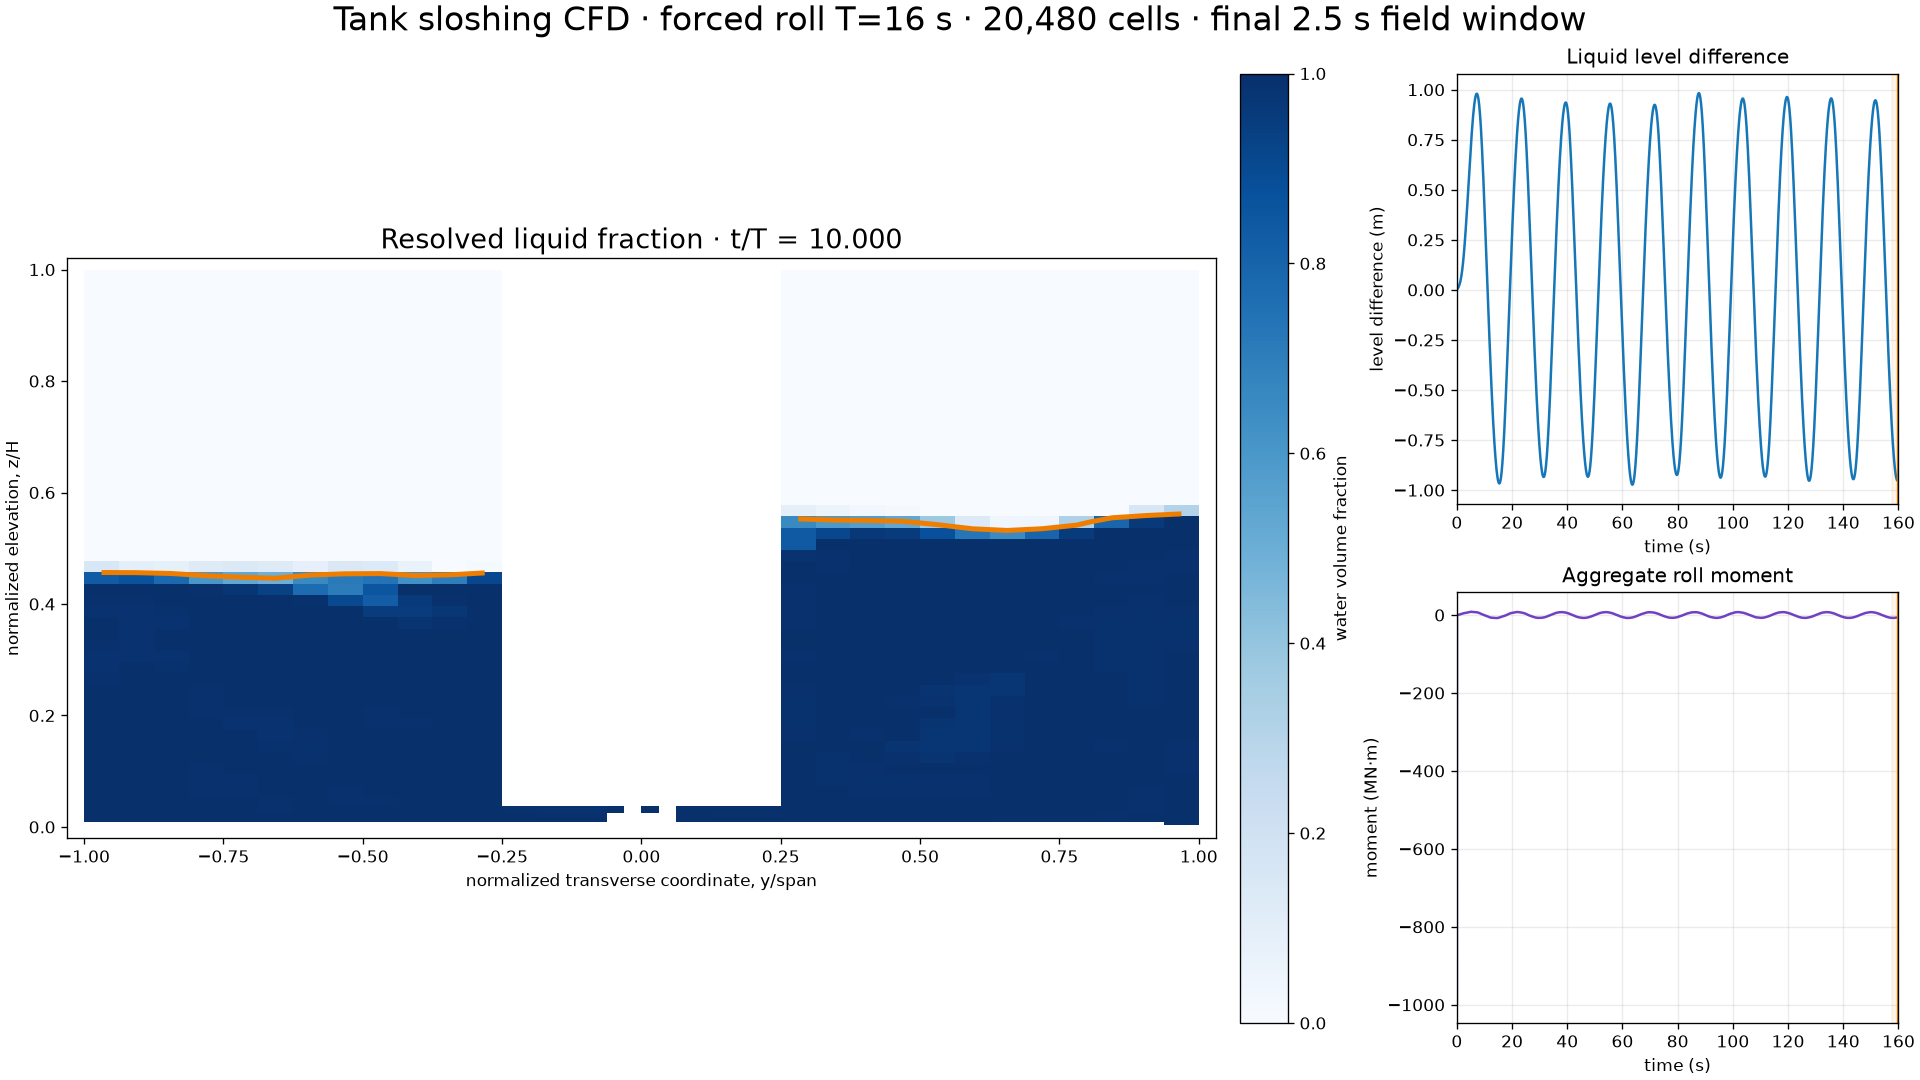
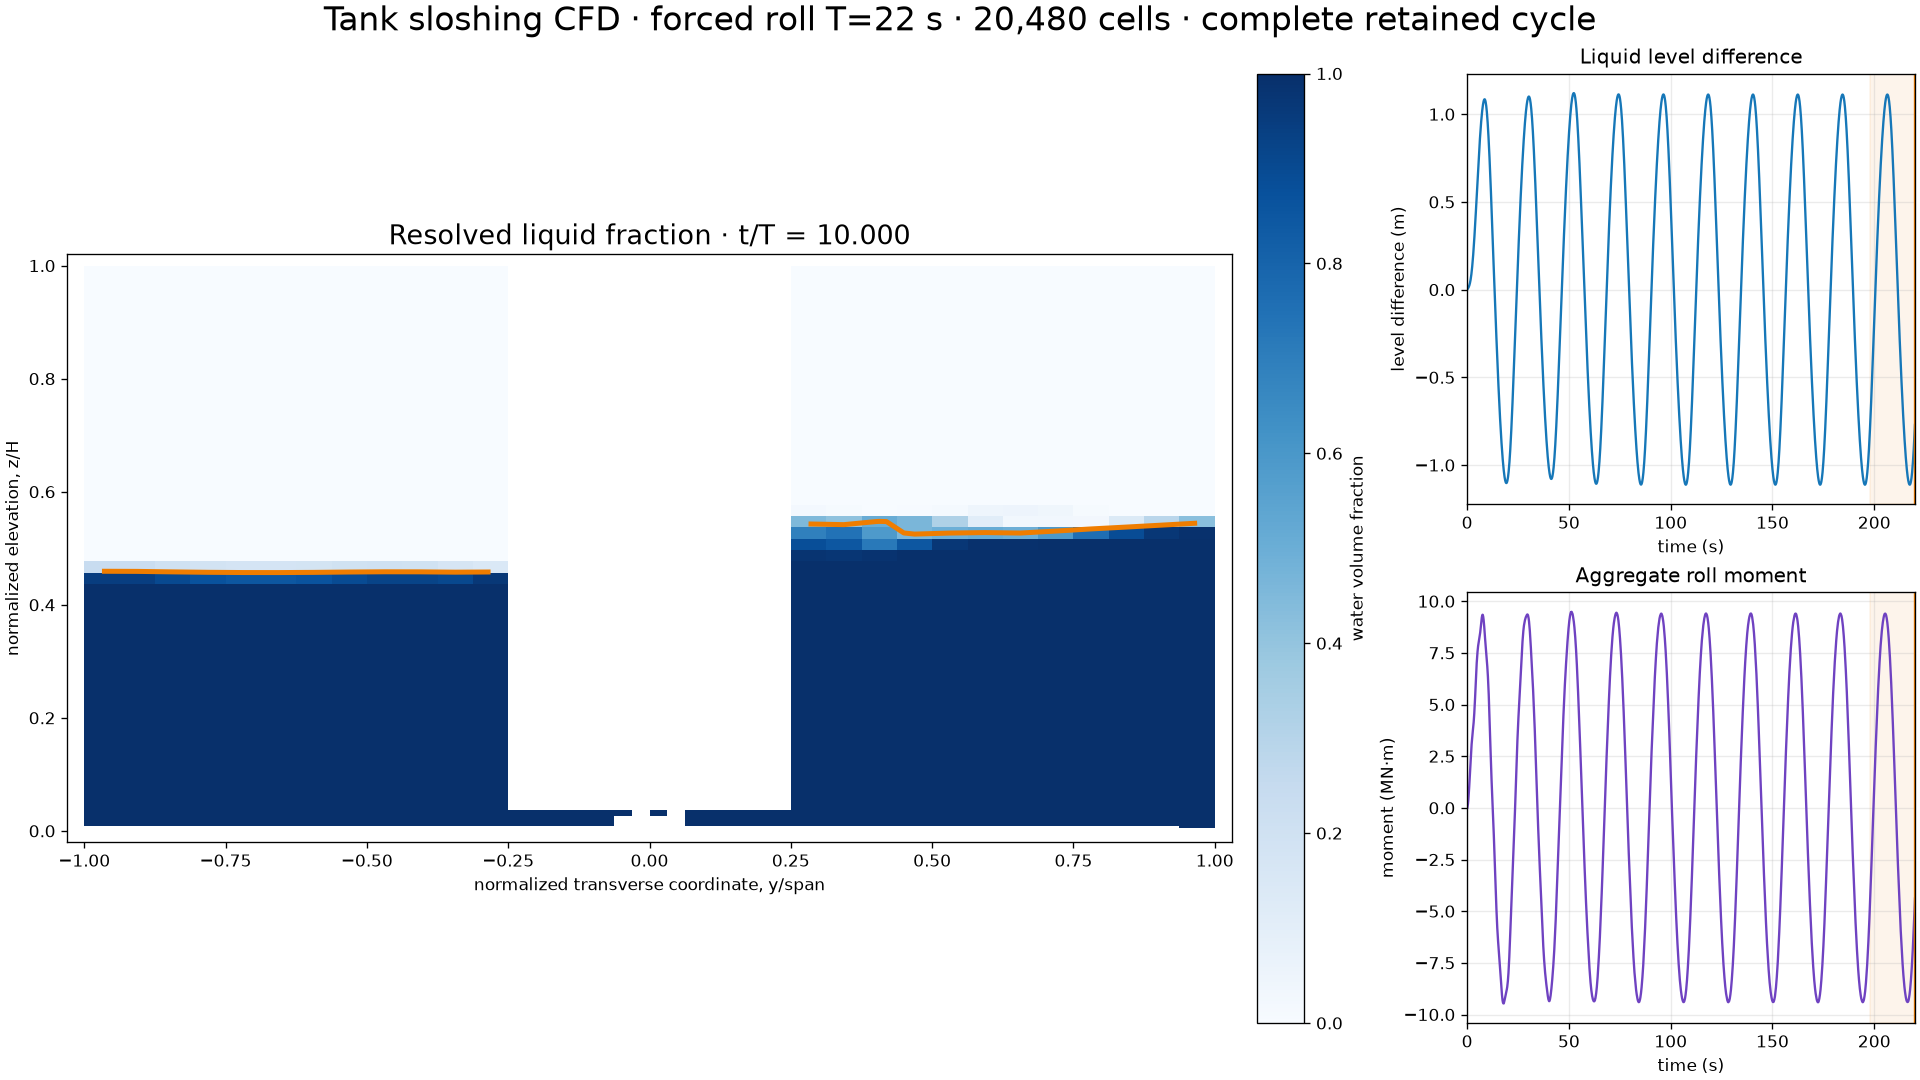
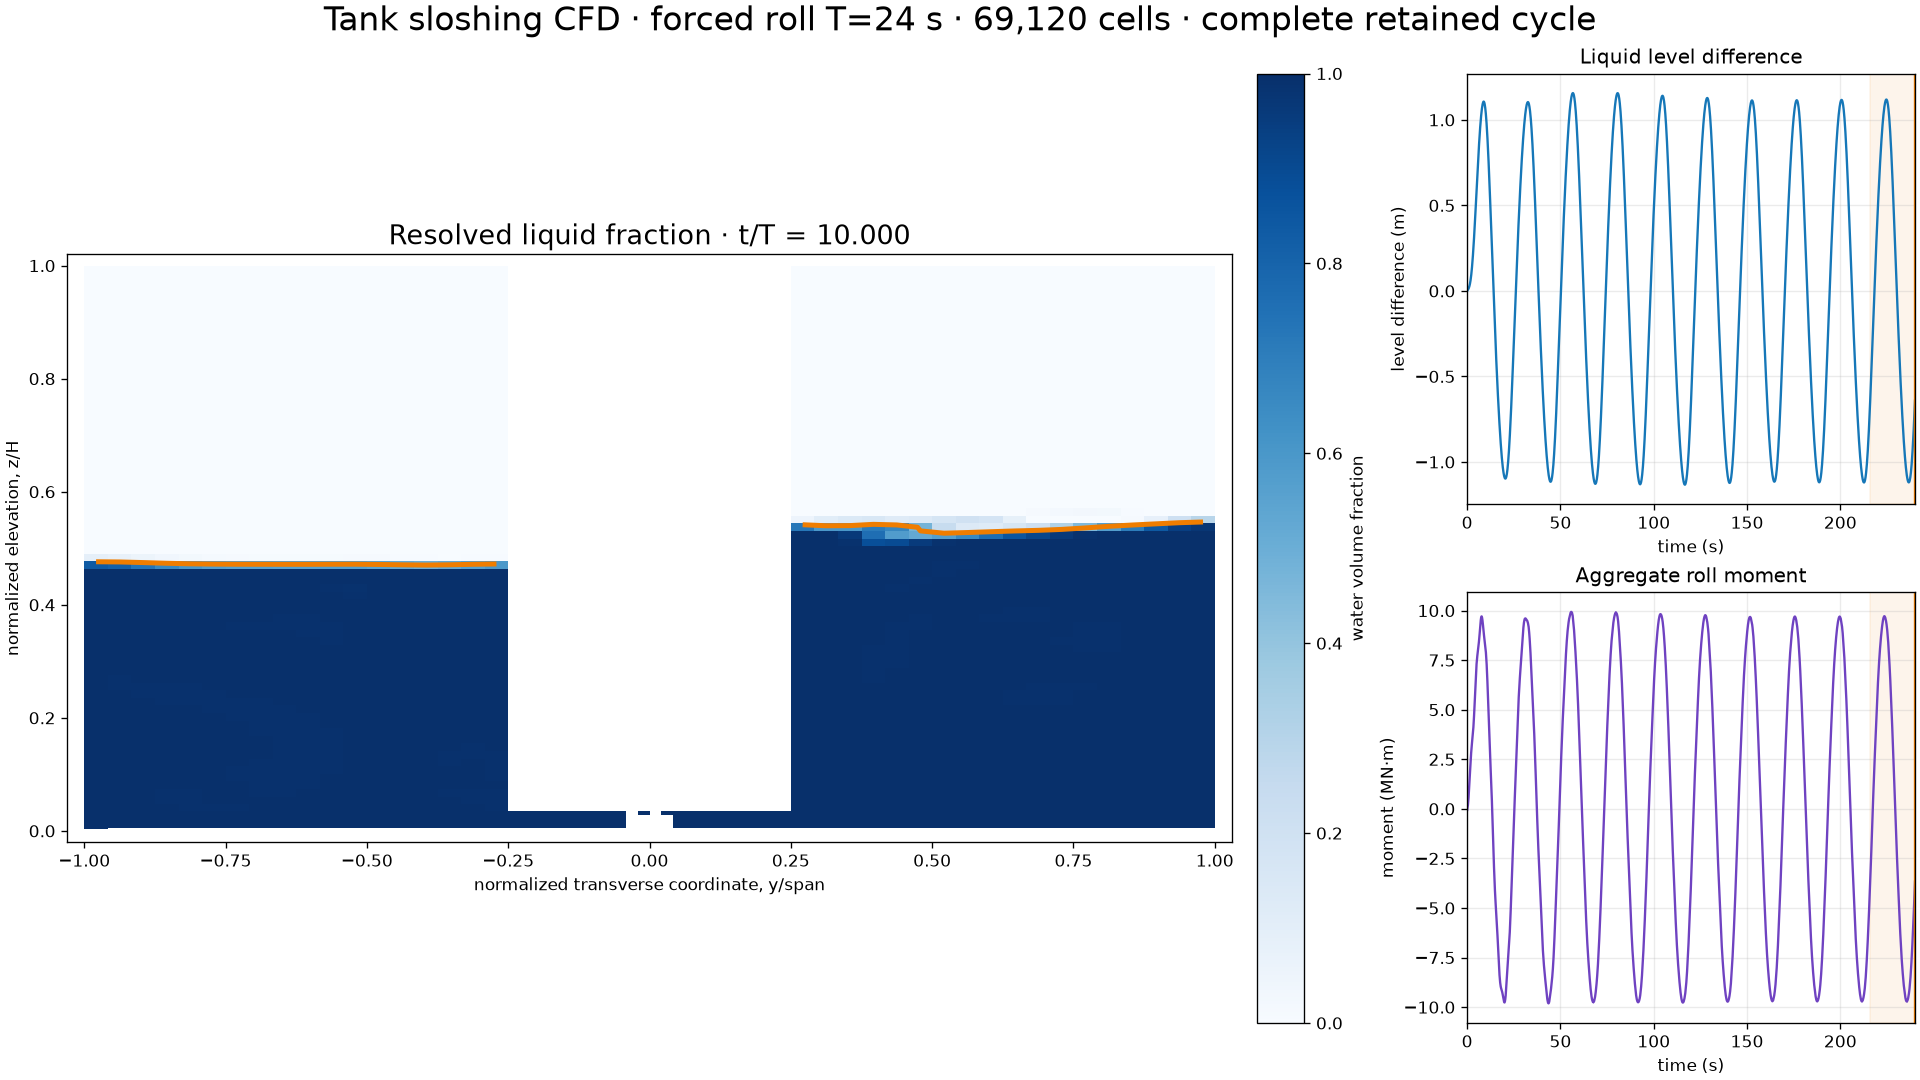
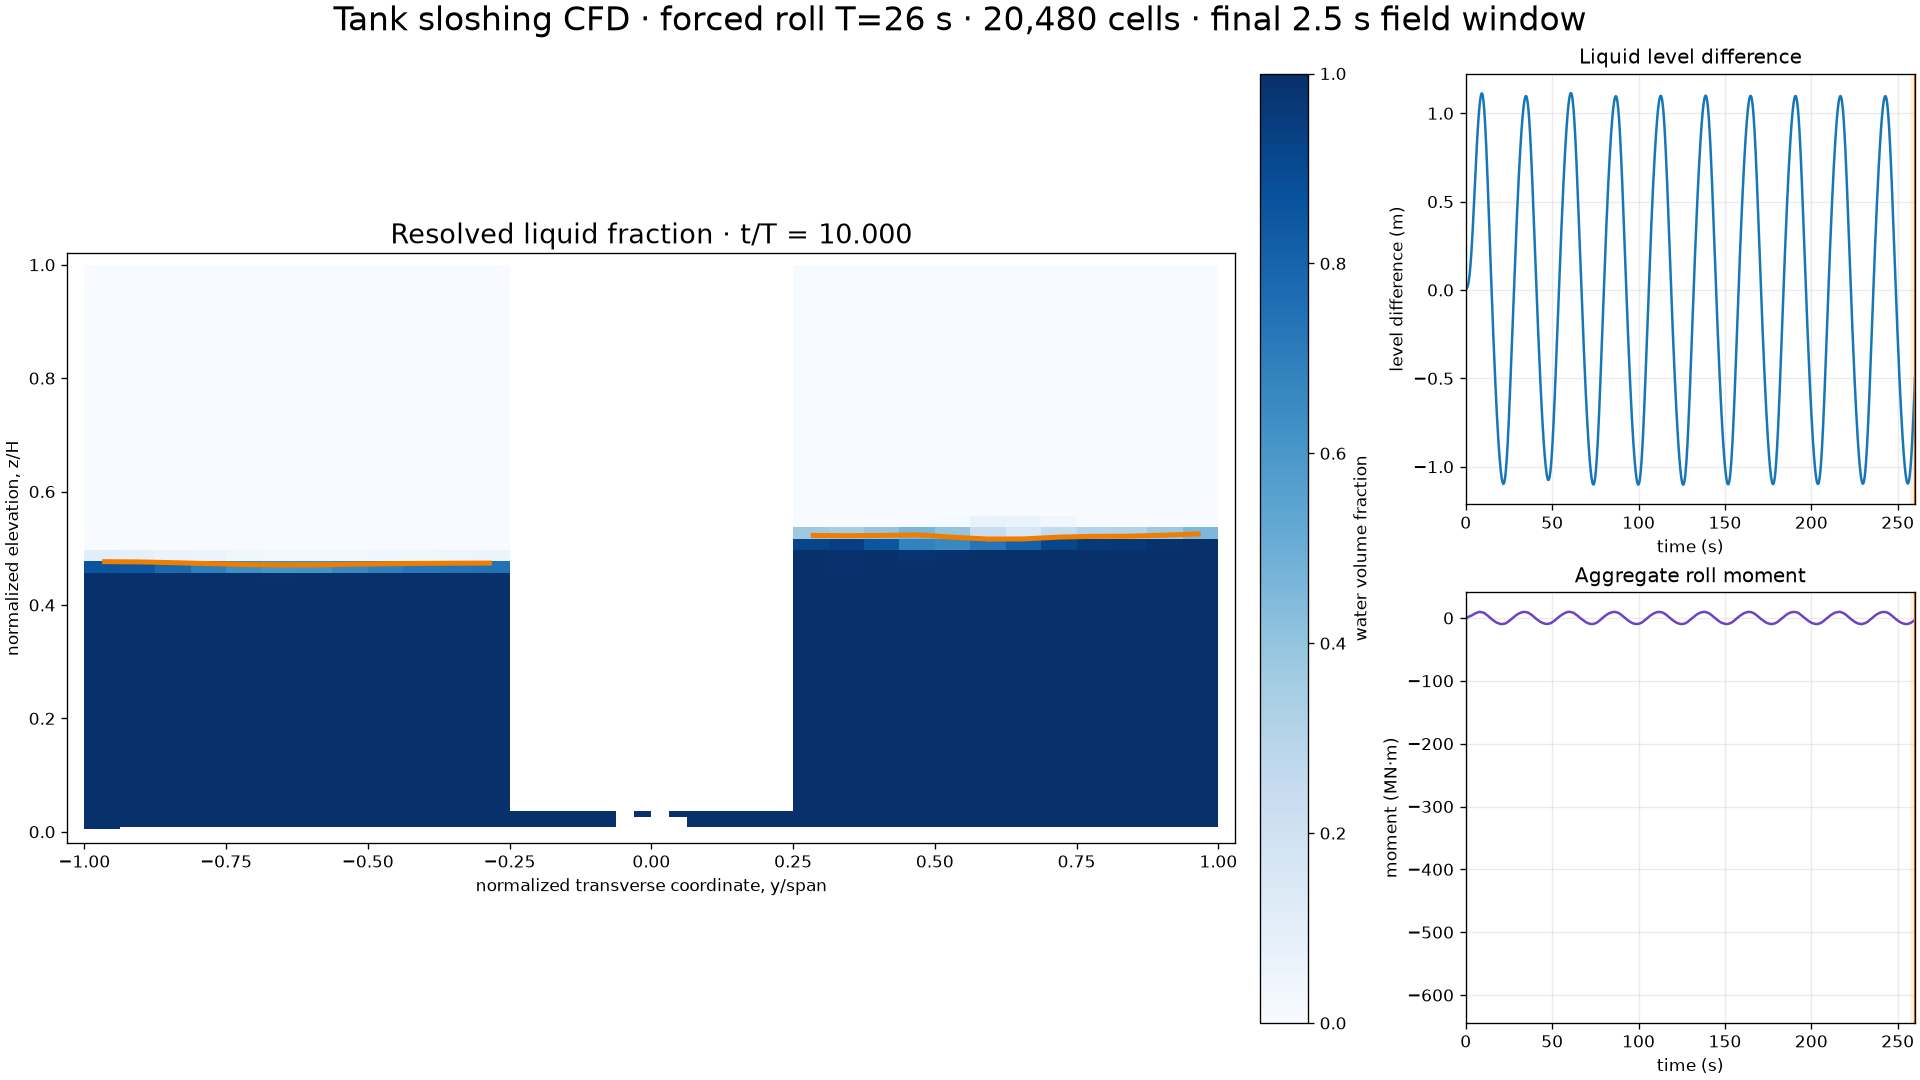
These are case-specific CFD snapshots and synchronized response graphs. The new 22 s and fine 24 s media cover one complete final forcing cycle with no temporal interpolation; legacy 16 s and 26 s media remain shorter final-window context.
16 s · medium meshCase-specific CFD evidence · open 1080p video22 s · medium meshComplete final forcing cycle · no interpolation24 s · fine mesh · Co 0.25 targetComplete cycle · pressure and Courant QA26 s · medium meshCase-specific CFD evidence · open 1080p video
05 · Validation and QA
Why the result is qualified rather than simply marked “passed”
Frequency verification
The mesh and timestep series remains within approximately 0.3% of the analytical target. This is the strongest validation statement supported by the public release.
The new pressure-resolved fine case reduced the observed maximum Courant number from 0.478 to 0.326. It completed and converged, but still exceeded its tighter configured target of 0.25.
Period-dependent forced-roll response and 21–25 s refinement
Medium/fine response comparison at 24 s
Stationary numerical baseline
Aggregate and left/right sectional loads
Complete-cycle fields and detailed pressure evidence for representative cases
Not established
Three-dimensional end-wall and local impact effects beyond the disclosed model
Response across other fill levels or roll amplitudes
Vessel-level anti-roll performance
Private geometry reconstruction
Measurement updateThe 22–24 s region is the amplitude peak for the published 5° sweep, not the exchange natural period. The measured natural period is 14.31 s, while the amplitude peak moves from 20 s to 40 s across the 2.5°–10° roll-amplitude grid.
07 · Navigate the evidence
One place to reach every report
The same reviewed campaign is published two ways: interactive pages to explore, and standalone report pages to read or print. Every destination below is also on the navigation bar of every page.
Understand
Screening
Interactive study
Campaign structure, verification and forced-response curves; select and export.